How Action Research Improves Instructional Design

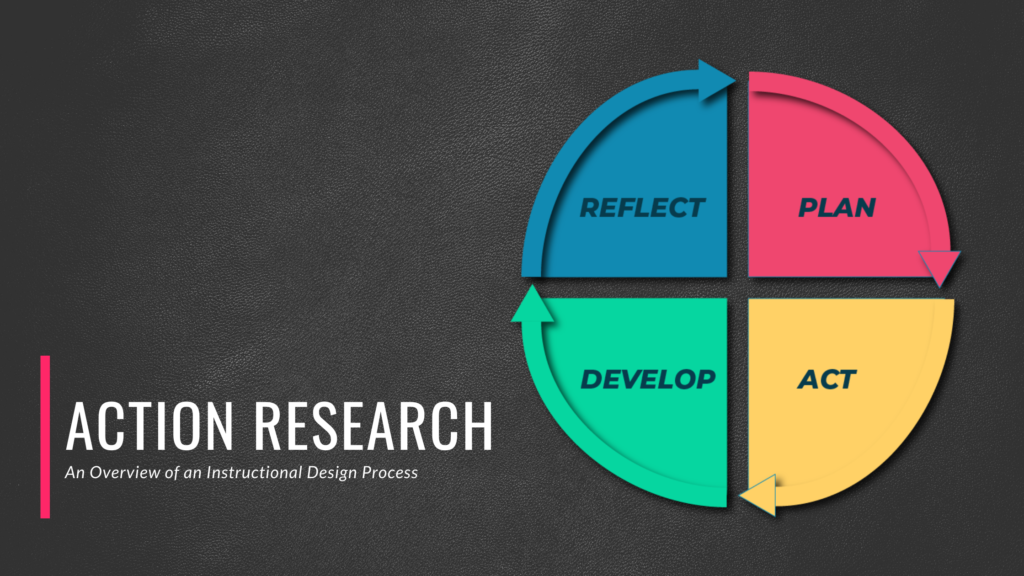
You may have heard of continuous quality improvement in business. We see this concept in practice all the time, whether it is in different versions of apps, phones, and software or in improvement on models of cars and our favorite products. As businesses we seek to improve our products and services to better meet the needs of our clients. The same is true in instructional design. While there are myriad challenges when it comes to developing educational content for adults that is engaging, meaningful, and practical, such a task becomes even more difficult when we don’t apply an iterative process to improve these resources over time. This is where Action Research comes in. Developed as a constructivist model of learning in the 1960’s and 70’s (Masters, 1995), Action Research is useful tool for developing and improving instructional content. The process (as seen in the above image) has 4 key phases that are iteratively repeated to enhance and refine instruction. You may notice that this model shares a number of similarities with the ADDIE model which is commonly referenced in instructional design. In a future post we will discuss the theoretical underpinnings of these two models. The first of the these phases is plan. In this phase we work with managers and stakeholders to determine the objectives and outcomes of the instructional unit. Additionally, we begin the processes of working with SMEs to conduct Action Mapping (Moore, 2017), storyboarding, and content development. An important part of this first phase is also determining where data of the user experience and outcomes will be collected. This is critical as it will serve to inform our decision making process in later phases. Typically, we will try to triangulate our data (Denzin, 2007) to get a clearer picture of areas of improvement. Once we have created a plan and the requisite resources, the next phase is to Act. In the Act phase, the content is delivered and data is collected. Based on the amount of data required, the specific use case, number of active users, and other factors, the length of time this phase takes could last for days or weeks. It is important to note that this phase should not take extended periods of time as we then lose the ability to make quicker adjustments to our instructional model. When looking at systems such as the Agile framework, these testing phases may run in the 1-2 week time frame (Cao, Mohan, Xu, & Ramesh, 2009). Once the Act phase is complete, we begin work on the Develop phase. This is where the data is analyzed and triangulated to identify key areas for change. This may include both quantitative and qualitative data based on how we set up our program in the Plan phase. Some of the key concepts to keep in mind in this phase is to attempt to keep as objective a view point on the data as possible. Also, we should avoid identifying reasoning or explanations for emerging trends at this stage. Additionally, what is not showing up in the trends can be as important as what does show up in our data. For example, when looking at items like free response questions or feedback from users, understanding what items are missing from these answers can often be an important indicator as to what may be missing from the learning environment. If we have a key feature or principle that we are interested in, the lack of its mention or prominence in our data may suggest that this feature or concept is not fully understood or utilized. As these trends are identified and analyzed, we should also begin to rank them in order of prominence and divide them by areas of impact. These areas will be discussed more specifically and in detail in a separate post on triangulation and data analysis. Once we have completed these steps, we reunite as a team in the final phase, Reflect. With our analyzed data we now attempt to identify areas for improvement, why certain areas were found to be lacking, and begin to make a list of changes to be made. This meeting should also include SMEs and other stakeholders to provide better insight into these areas of concern. Upon the completion of this phase, we start back a the beginning with the Plan phase. However, instead of creating an instructional unit from scratch, we are now creating the changes necessary to address the concerns we identified from the first iteration. While this may include new content or revised content, it could also include additional data points for collection and analysis to better understand problem areas. This cycle should then be repeated at least one more time, but ideally a total of 3 times. Each subsequent cycle tends to narrow and eliminate the identified problems so 3 cycles has a tendency to eliminate or mitigate most concerns (List, 2006). This unique process allows for a model of continuous quality improvement that is focused, data-driven, and practical. In future posts, I will discuss each phase in greater detail and even break them into steps so that this model can be applied in your work environment. If you liked this post, have questions, or want to know more, please comment below. Thank you for reading!
References:
Cao, L., Mohan, K., Xu, P., & Ramesh, B. (2009). A framework for adapting agile development methodologies. European Journal of Information Systems, 18(4), 332-343.
Denzin, N. K. (2007). Triangulation. The Blackwell Encyclopedia of Sociology.
List, D. (2006). Action research cycles for multiple futures perspectives, Futures 38(6),pp. 673-684, doi: https://doi.org/10.1016/j.futures.2005.10.001.
Masters, J. (1995). The history of action research. Action research electronic reader, 22, 2005.
Moore, C. (2017). Map It: The Hands-On Guide to Strategic Training Design. Montesa Press.